Home > Research & Publications > alpha shape model analysis
Identifying EGFR mutation-induced drug resistance based on alpha shape model analysis of the dynamics

Abstract
Epidermal growth factor receptor (EGFR) mutation-induced drug resistance is a difficult problem in lung cancer treatment. Studying the molecular mechanisms of drug resistance can help to develop corresponding treatment strategies and benefit new drug design. In this study, Rosetta was employed to model the EGFR mutant structures. Then Amber was carried out to conduct molecular dynamics (MD) simulation. Afterwards, we used Computational Geometry Algorithms Library (CGAL) to compute the alpha shape model of the mutants. We analyzed the EGFR mutation-induced drug resistance based on the motion trajectories obtained from MD simulation. We computed alpha shape model of all the trajectory frames for each mutation type. Solid angle was used to characterize the curvature of the atoms at the drug binding site. We measured the knob level of the drug binding pocket of each mutant from two ways and analyzed its relationship with the drug response level. Results show that 90 % of the mutants can be grouped correctly by setting a certain knob level threshold. There is a strong correlation between the geometric properties of the drug binding pocket of the EGFR mutants and the corresponding drug responses, which can be used to predict the response of a new EGFR mutant to a drug molecule.
Keywords: Epidermal growth factor receptor (EGFR), Non-small-cell lung cancer (NSCLC), Gefitinib, Drug binding site, Molecular dynamics, Alpha shape modeling, Solid angle
Results

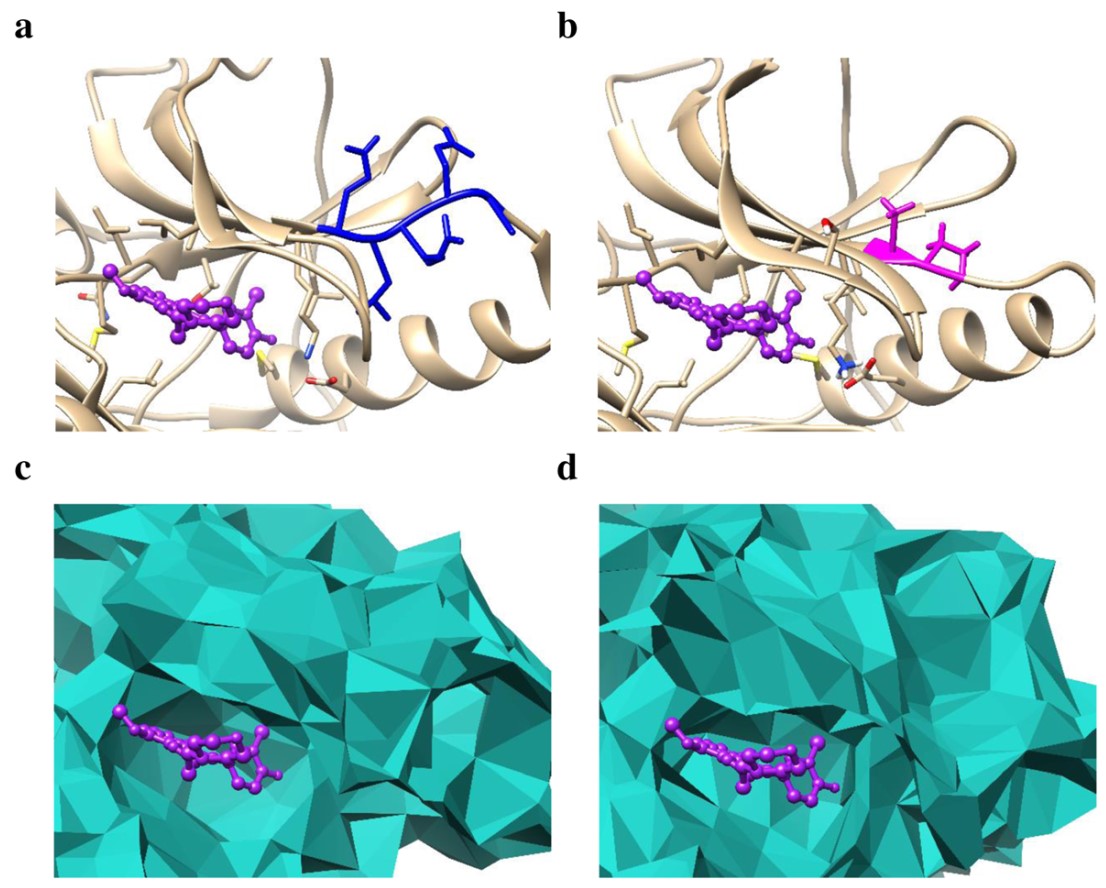
Figure 1. a and b show the comparison of the crystal structures of WT EGFR and the mutant delE746_A750insAP. c and d are the alpha shape models of the drug binding pocket of (a) and (b), respectively. The original site is colored blue while the corresponding mutant site is shown in magenta. The drug molecule (gefitinib) is displayed in purple

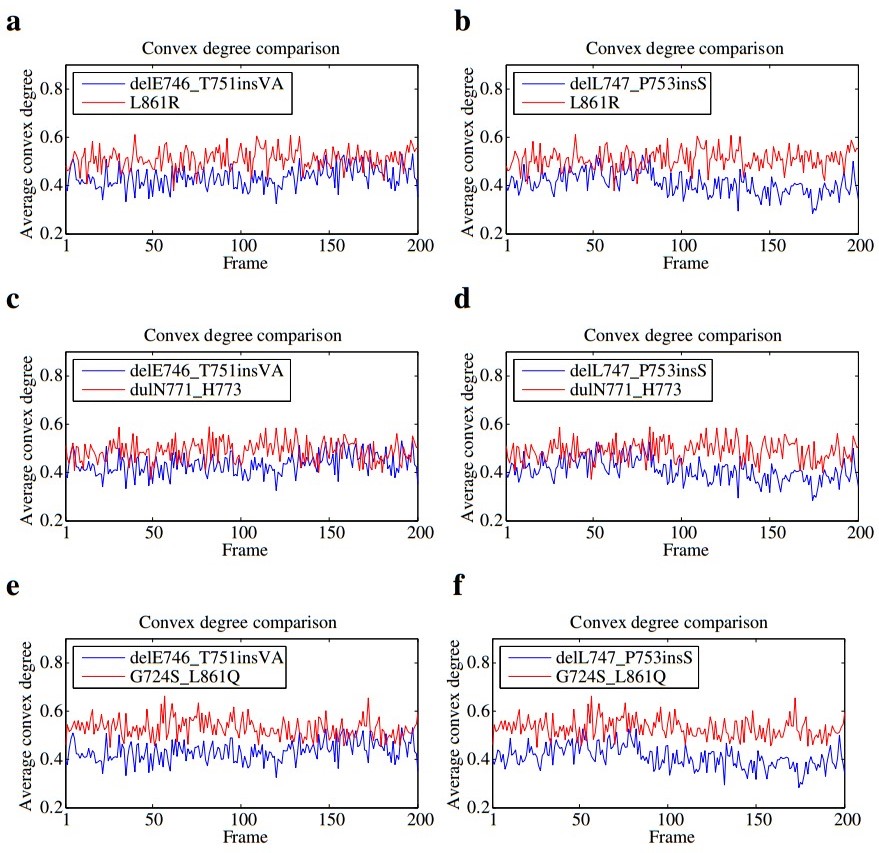
Figure 2. The comparison of average convex degrees of the drug Response mutants delE746_T751insVA (RL = 1, shown in a , c and e) and delL747_P753insS (RL = 2, shown in b, d and f ), and the No-response ones L861R (RL = 4), dulN771_H773 (RL = 4) and G724S_L861Q (RL = 4). The drug Response mutants are shown in blue, while the No-response ones are colored red

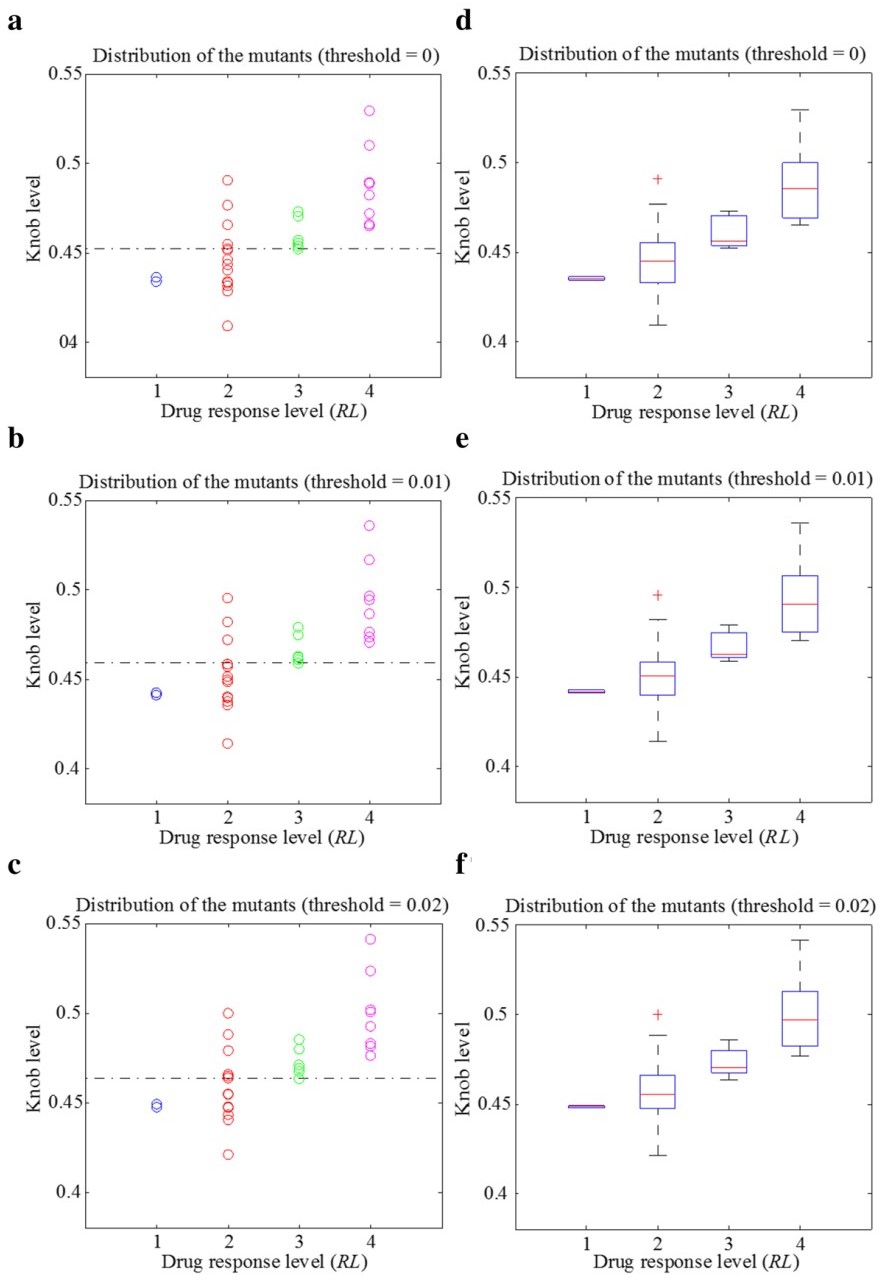
Figure 3. The relationship of knob level and drug response level of the 30 mutants, with the solid angle value threshold setting to 0, 0.01 and 0.02, respectively. a to c show the scatter plots of the mutants for each drug response level. d to f are the corresponding box plots of (a) to (c)

Figure 4. e and f show the statistics of the convex atoms and the atoms with SA > 0.7 at the average binding site of the 30 mutants. The mutants of each response level group are sorted in an ascending order by the number of convex atoms. Blue, red, green and magenta correspond to mutants with RL = 1, 2, 3 and 4
[Back]