An online database for visualization and analysis of cell morphologies and gene expressions throughout Caenorhabditis elegans embryogenesis.
Caenorhabditis elegans embryogenesis
Caenorhabditis elegans (abbr., C. elegans) is a kind of transparent nematode that naturally lives in soil and eats microorganisms. Its embryogenesis takes place in an ellipsoidal-like eggshell and lasts for around 10-12 hours at room temperature (20 ℃) [1], producing ~ 550 cells with multiple fates such as the pharynx and intestine [2]. Fig. 1 is the anatomical drawing of a hermaphrodite adult containing numerous self-fertilized embryos developing inside the parent’s body.
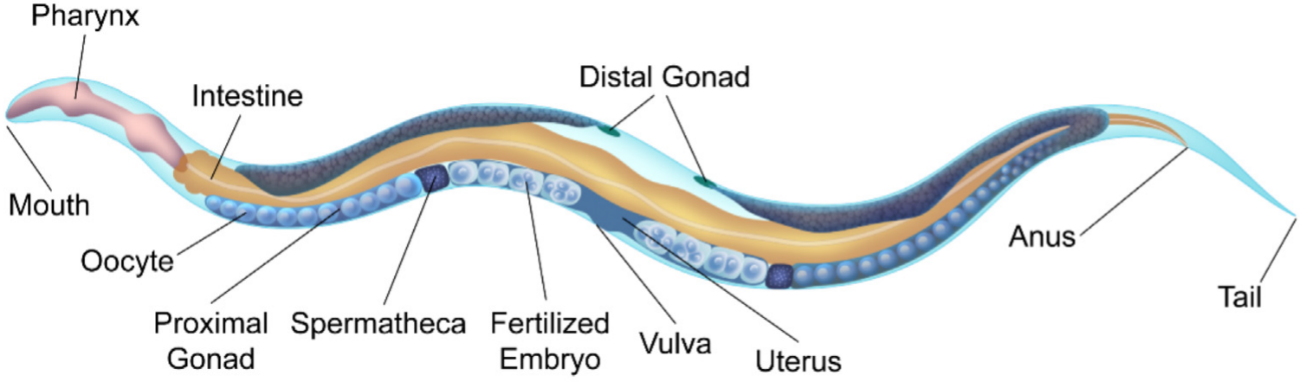
Fig.1 (Ref. [3])
C. elegans is famous for its eutelic and stereotypical embryogenesis programs at a single-cell level, which means all the cells in this creature are unidentical and identifiable considering their cell division timing, cell position and cell morphology, cell fate, and so forth [4]. Fig. 2 illustrates a partial embryonic cell lineage tree with experimentally-measured cell cycle length as the branch, labeled with a red bar representing the variation among > 200 embryo samples. Fig. 3 shows the cell position and cell morphology (visualized by computationally segmented cell membranes; colored based on cell fates and cell identities), which are highly deterministic among embryo samples.
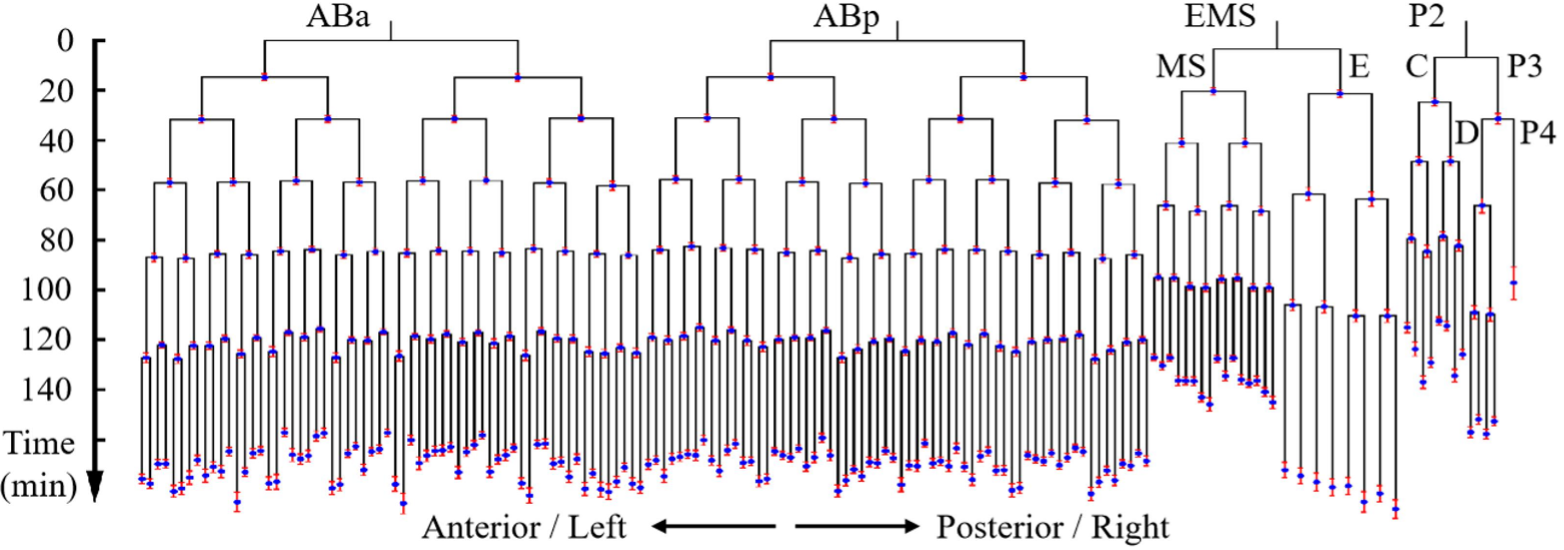
Fig.2 (Ref. [5])
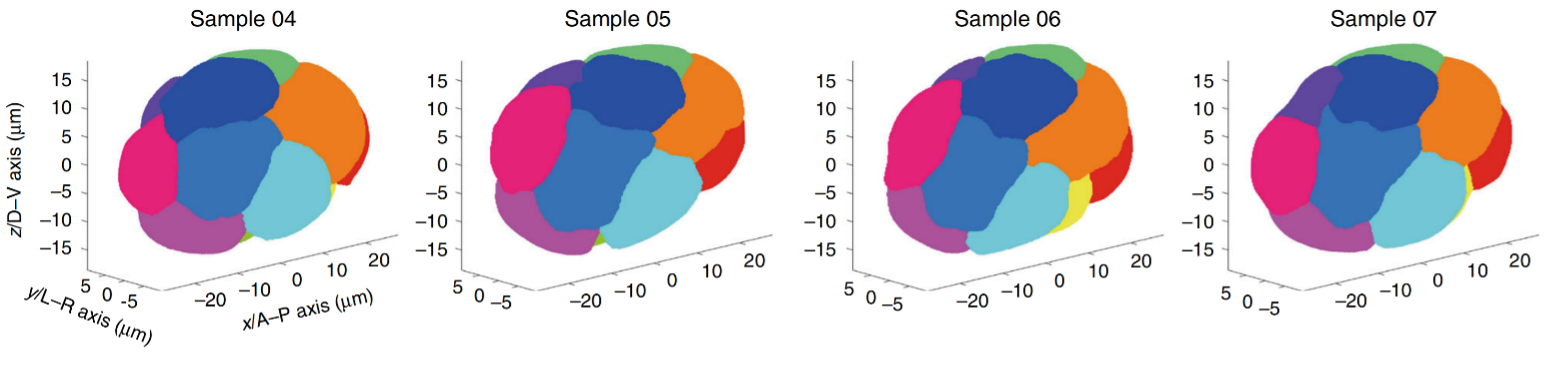
Fig.3 (Ref. [6])
C. elegans research has raised a lot of advances in basic science and technical application that has profound impacts, serving as a powerful animal model for investigating all kinds of problems. For example, the 2002 Nobel Prize in Physiology or Medicine was awarded to Sydney Brenner, H. Robert Horvitz, and John E. Sulston ‘‘for their discoveries concerning genetic regulation of organ development and programmed cell death”. The 2006 Nobel Prize in Physiology or Medicine was awarded to Andrew Z. Fire and Craig C. Mello ‘‘for their discovery of RNA interference – gene silencing by double-stranded RNA”. These and other breakthroughs have opened the era of systematic study on C. elegans embryogenesis from molecular to organismal levels.
References:
[1] Byerly L, Cassada RC, Russell RL. The life cycle of the nematode Caenorhabditis elegans. I. Wild-type growth and reproduction. Dev. Biol. 1976;51(1):23-33.
[2] Kenyon C. Cell lineage and the control of Caenorhabditis elegans development. Philos. Trans. R. Soc. Lond. B Biol. Sci. 1985;312(1153):21-38.
[3] Guan G, Zhao Z, Tang C. Delineating the mechanisms and design principles of Caenorhabditis elegans embryogenesis using in toto high-resolution imaging data and computational modeling. Comput Struct Biotechnol J. 2022;20:5500-5515.
[4] Sulston JE, Schierenberg E, White JG, Thomson JN. The embryonic cell lineage of the nematode Caenorhabditis elegans. Dev. Biol. 1983;100(1):64-119.
[5] Guan G, Wong M-K, Ho VWS, An X, Chan L-Y, Tian B, Li Z, Tang L-H, Zhao Z, Tang C. System-level quantification and phenotyping of early embryonic morphogenesis of Caenorhabditis elegans. bioRxiv 2019; 776062
[6] Cao J, Guan G, Ho VWS, Wong M-K, Chan L-Y, Tang C, Zhao Z, Yan H. Establishment of a morphological atlas of the Caenorhabditis elegans embryo using deep-learning-based 4D segmentation. Nat Commun. 2020;11(1):6254.
Time-lapse live imaging for multidimensional data collection
The divisions and positions of all the cells throughout C. elegans embryogenesis can be visualized by fluorescently labeling cell nuclei and traced by the software StarryNite (automatic part) and AceTree (manual part), at an imaging interval of ~ 1.5 min [1] [2] [3]. Meanwhile, the membranes of all the cells can be tagged with another fluorescence protein and imaged together with nuclei in two different channels simultaneously and segmented by an algorithm like CShaper [4]. Fig. 1 presents an embryo with GFP labeling cell nuclei and mCherry labeling cell membranes, followed by nucleus tracing and membrane segmentation shown on the top and bottom.
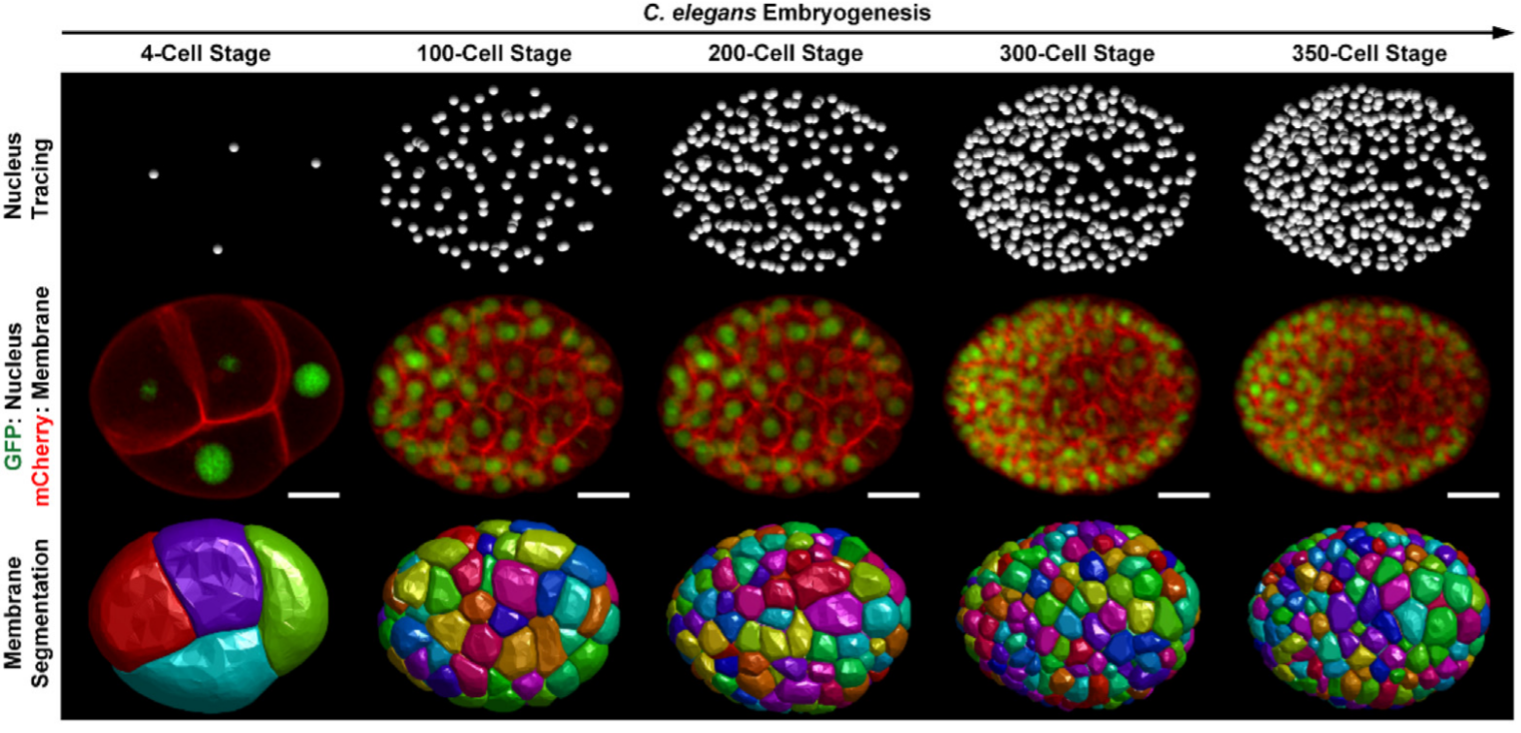
Fig.1 (Ref. [5])
When replacing the membrane marker with another one to visualize the expression of any gene of interest by promoter fusion or protein fusion, the cell-resolved expression pattern of the whole embryo can be quantitatively monitored, aided by the software AceTree [6] [7]. Fig. 2 presents an embryo with GFP labeling cell nuclei and mCherry labeling promoter activity of the muscle-specific transcription factor hlh-1, followed by nucleus tracing and expression profiling shown on the bottom.
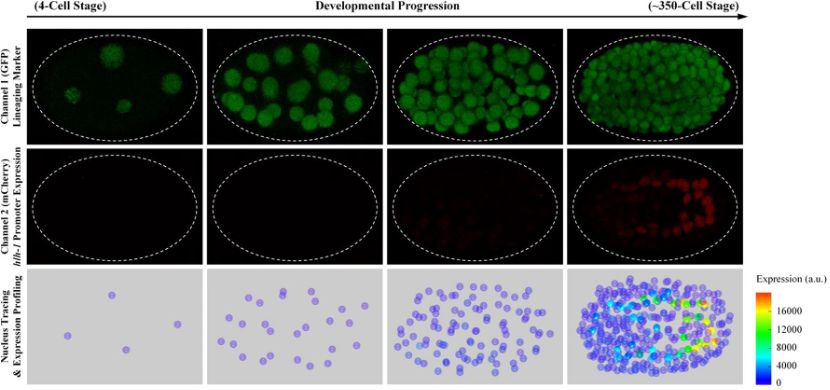
Fig.2 (Ref. [8])
References:
[1] Bao Z, Murray JI, Boyle T, Ooi SL, Sandel MJ, Waterston RH. Automated cell lineage tracing in Caenorhabditis elegans. Proc. Natl. Acad. Sci. U. S. A. 2006;103(8):2707-2712.
[2] Murray JI, Bao Z, Boyle TJ, Waterston RH. The lineaging of fluorescently-labeled Caenorhabditis elegans embryos with StarryNite and AceTree. Nat. Protoc. 2006;1(3):1468-1476.
[3] Boyle TJ, Bao Z, Murray JI, Araya CL, Waterston RH. AceTree: A tool for visual analysis of Caenorhabditis elegans embryogenesis. BMC Bioinform. 2006;7:275.
[4] Cao J, Guan G, Ho VWS, Wong M-K, Chan L-Y, Tang C, Zhao Z, Yan H. Establishment of a morphological atlas of the Caenorhabditis elegans embryo using deep-learning-based 4D segmentation. Nat. Commun. 2020;11:6254.
[5] Guan G, Zhao Z, Tang C. Delineating the mechanisms and design principles of Caenorhabditis elegans embryogenesis using in toto high-resolution imaging data and computational modeling. Comput. Struct. Biotechnol. J. 2022;20:5500-5515.
[6] Murray JI, Bao Z, Boyle TJ, Boeck ME, Mericle BL, Nicholas TJ, Zhao Z, Sandel MJ, Waterston RH. Automated analysis of embryonic gene expression with cellular resolution in C. elegans. Nat. Methods 2008;5(8):703-709.
[7] Murray JI, Bao Z. Automated lineage and expression profiling in live Caenorhabditis elegans embryos. Cold Spring Harb. Protoc. 2012;887-899.
[8] Guan G, Fang M, Wong M-K, Ho VWS, An X, Tang C, Huang X, Zhao Z. Multilevel regulation of muscle-specific transcription factor hlh-1 during Caenorhabditis elegans embryogenesis. Dev. Genes Evol. 2020;230(4):265-278.